Hardware and Sustainability KPIs
MetricsHub collects the hardware health and performance metrics as well as the sustainability KPIs of any server, storage system, or network switch available in your on-prem infrastructure and exposes the telemetry data in the Hardware Main (MetricsHub), Hardware Site (MetricsHub), and Hardware Host (MetricsHub) Grafana dashboards.
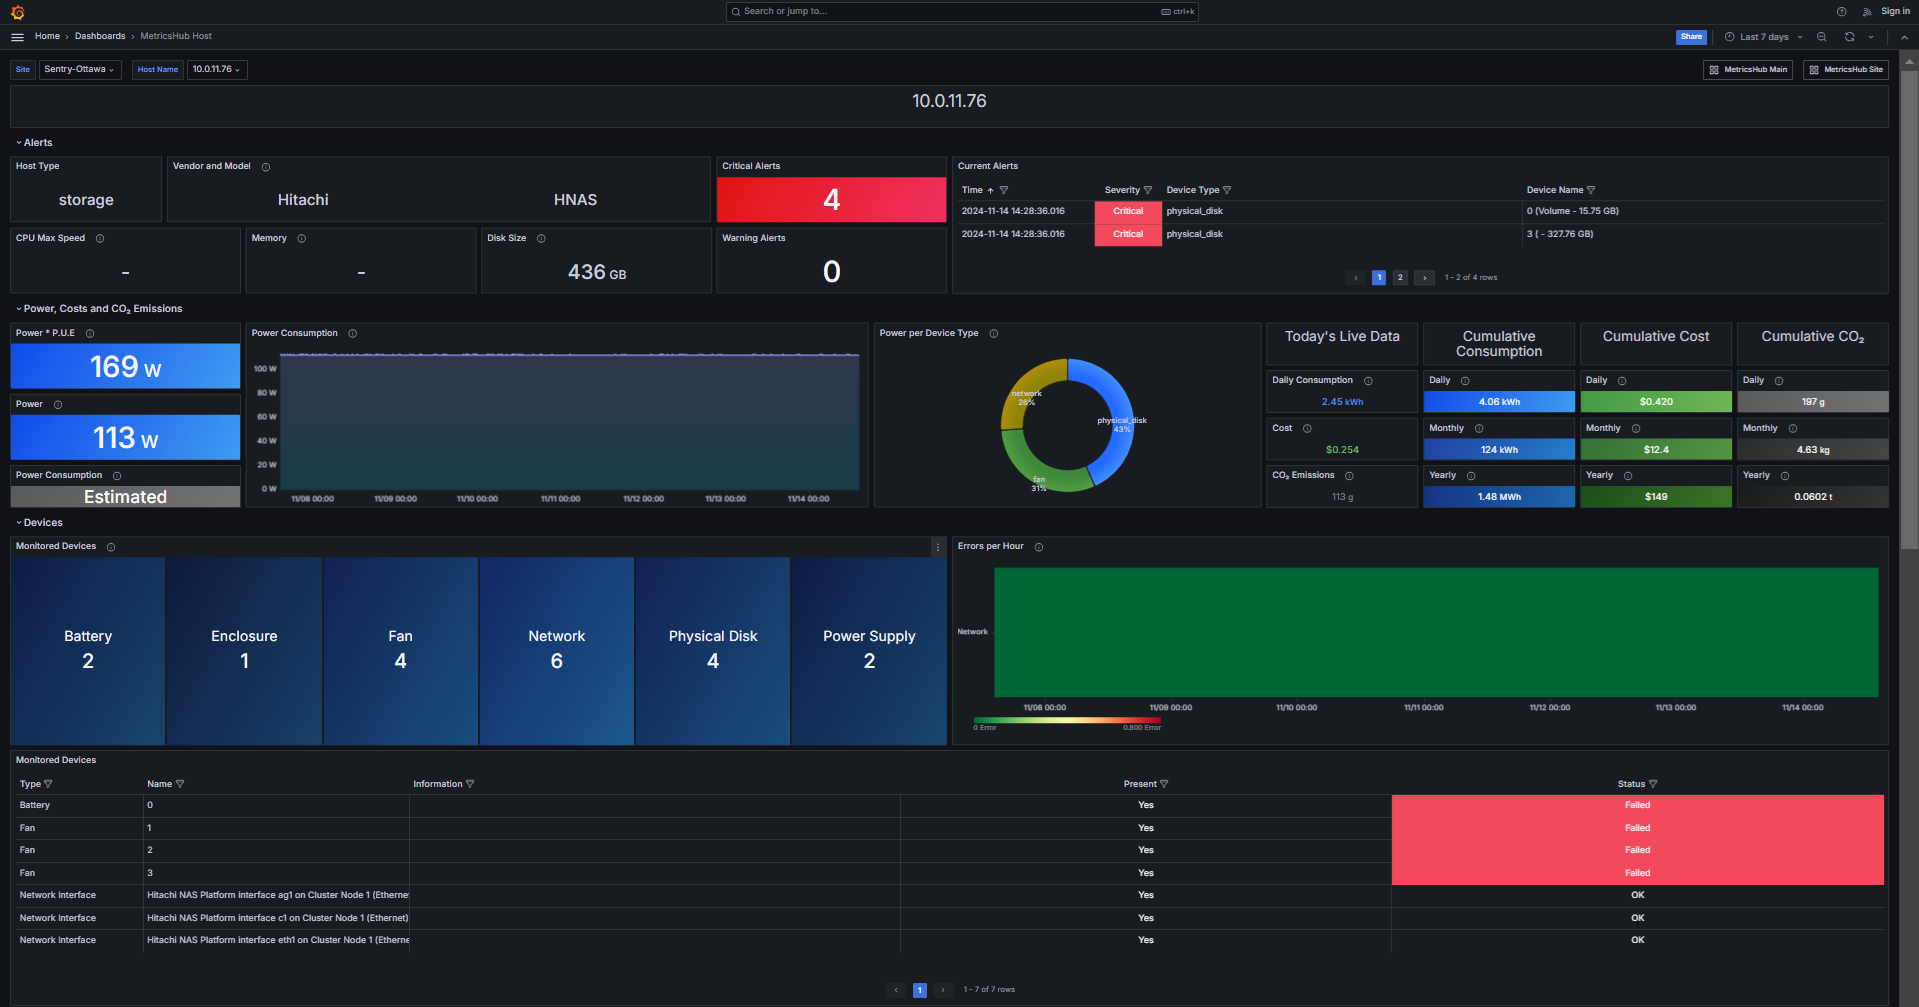
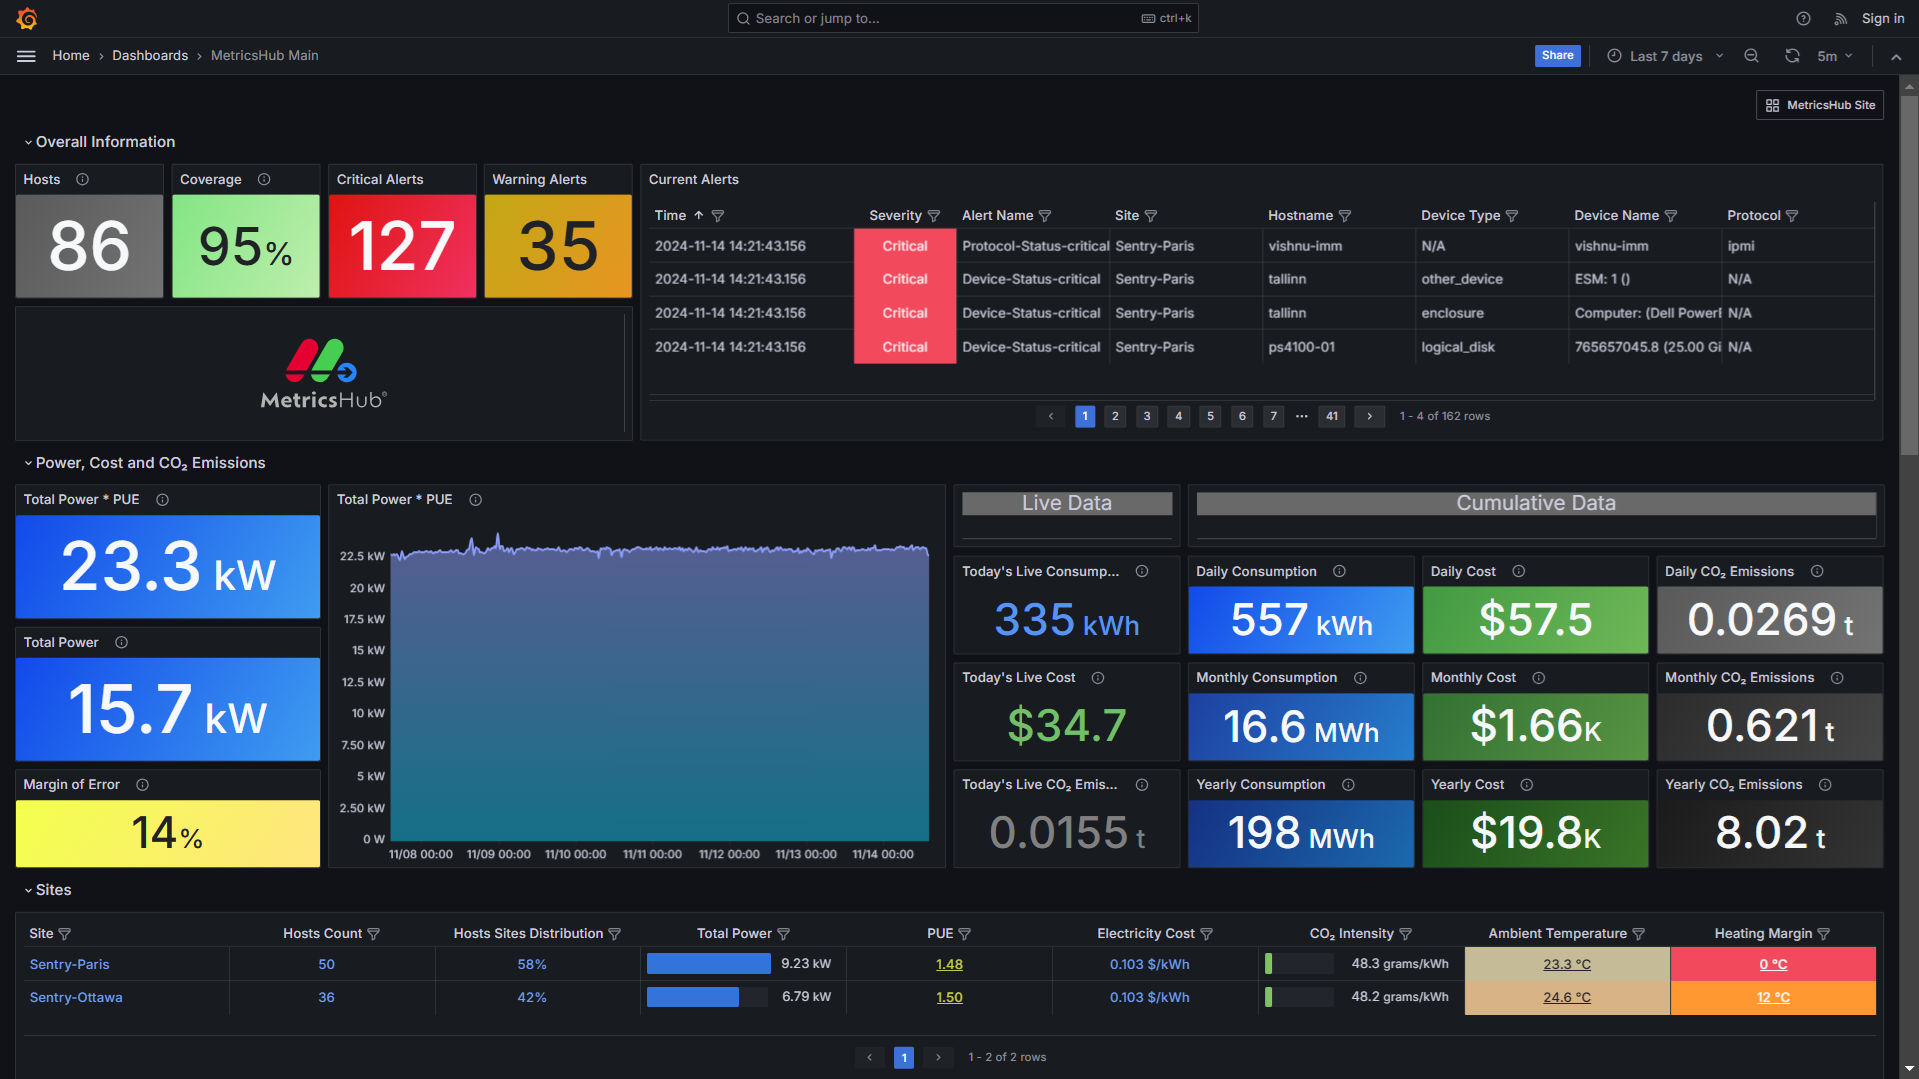
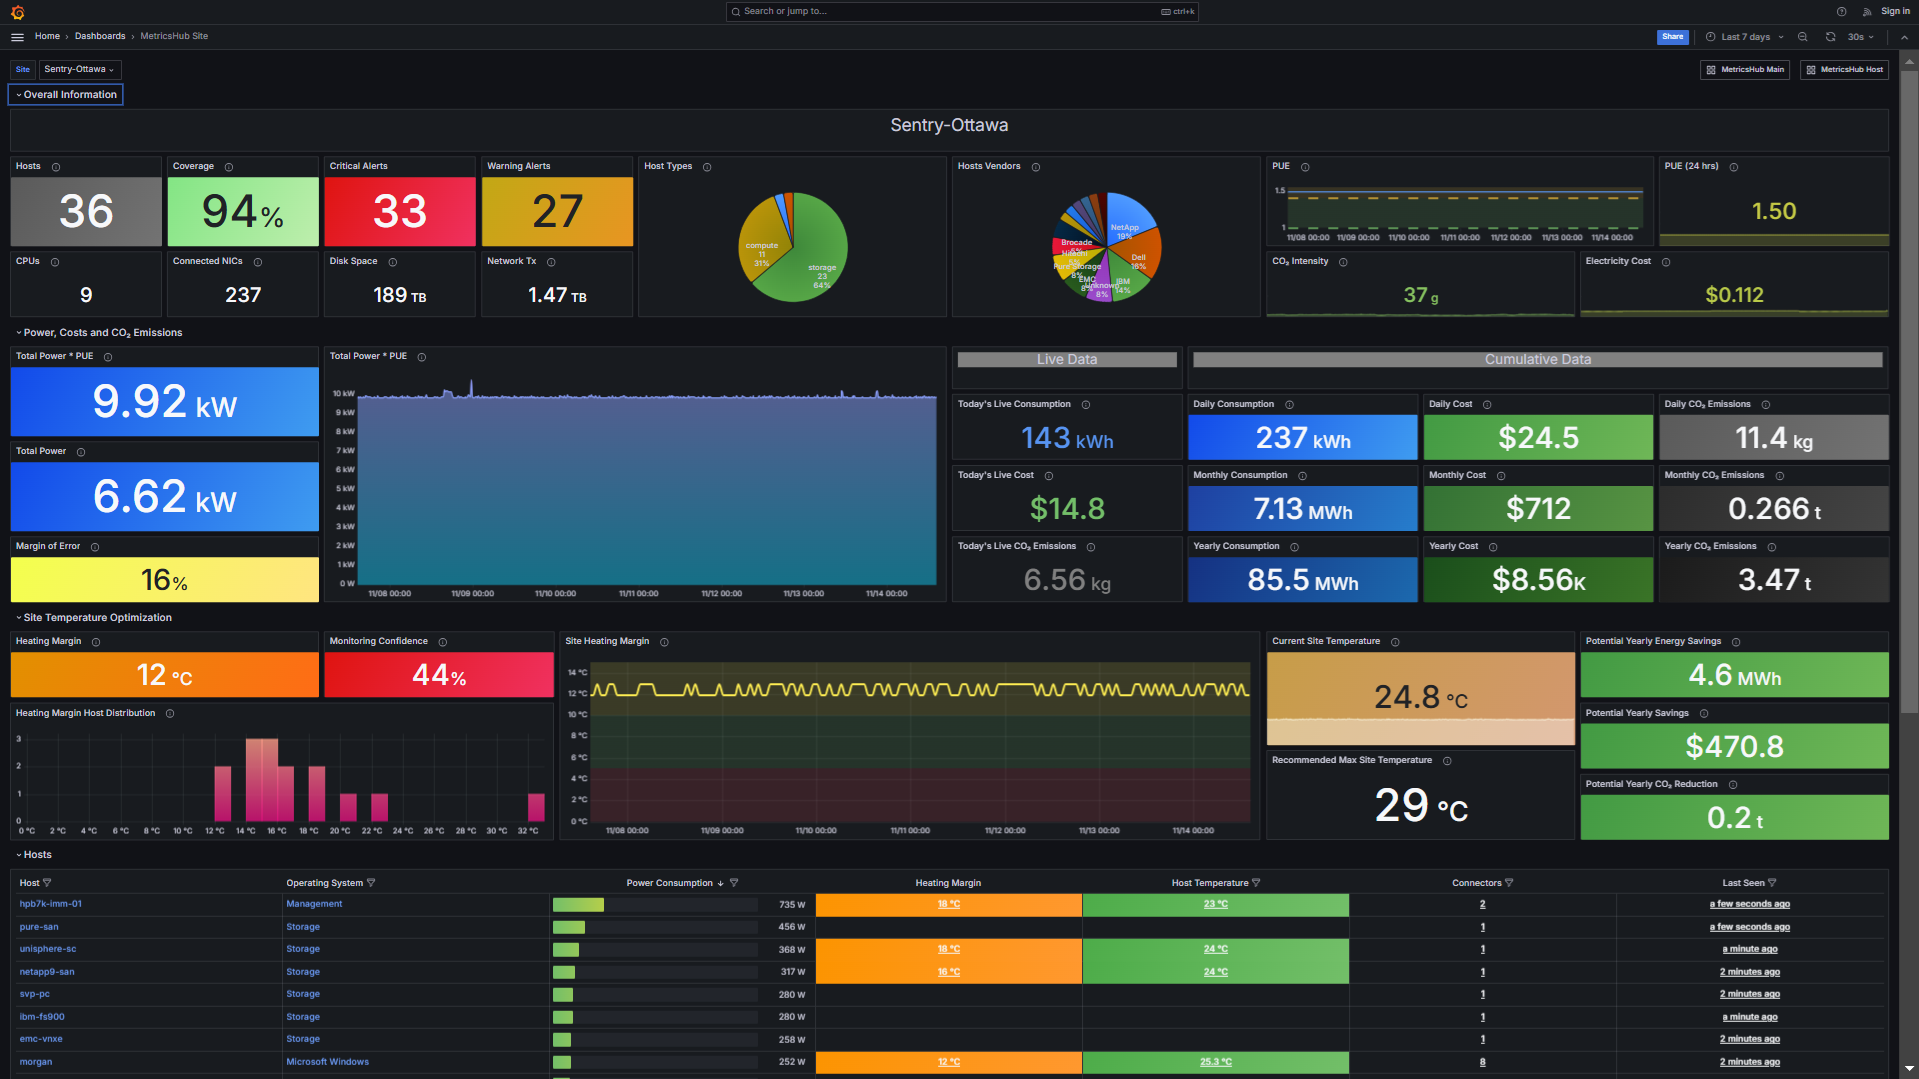
MetricsHub Main - Overview of all monitored sites
This section explains how to import these dashboards into Grafana.
Prerequisites
Before importing the MetricsHub dashboards in Grafana, ensure that you have:
- configured the monitoring of your resources
- configured the sustainability metrics
- configured the Prometheus Server
- run both MetricsHub and the Prometheus server.
Importing the MetricsHub dashboards
-
Log on to Grafana
-
Import the dashboard(s)
-
Enter the dashboard ID:
22053for the Hardware Main (MetricsHub) dashboard22052for the Hardware Site (MetricsHub) dashboard22051for the Hardware Host (MetricsHub) dashboard
-
Click Load
-
Select the Prometheus datasource
-
Click Import
-
Repeat the procedure to import all the Hardware (MetricsHub) dashboards.
The MetricsHub dashboards are now loaded in Grafana:
| Dashboard | Description |
|---|---|
| Hardware Main (MetricsHub) | Overview of all monitored sites |
| Hardware Site (MetricsHub) | Metrics associated to one site (a data center or a server room) and its monitored hosts |
| Hardware Host (MetricsHub) | Metrics associated to one host and its internal components |