System Performance
MetricsHub collects and normalizes system performance metrics from AIX, HP-UX, Linux, and Windows platforms and exposes them in the System Performance Metrics – Overview (MetricsHub) and System Performance Metrics (MetricsHub) Grafana dashboards.
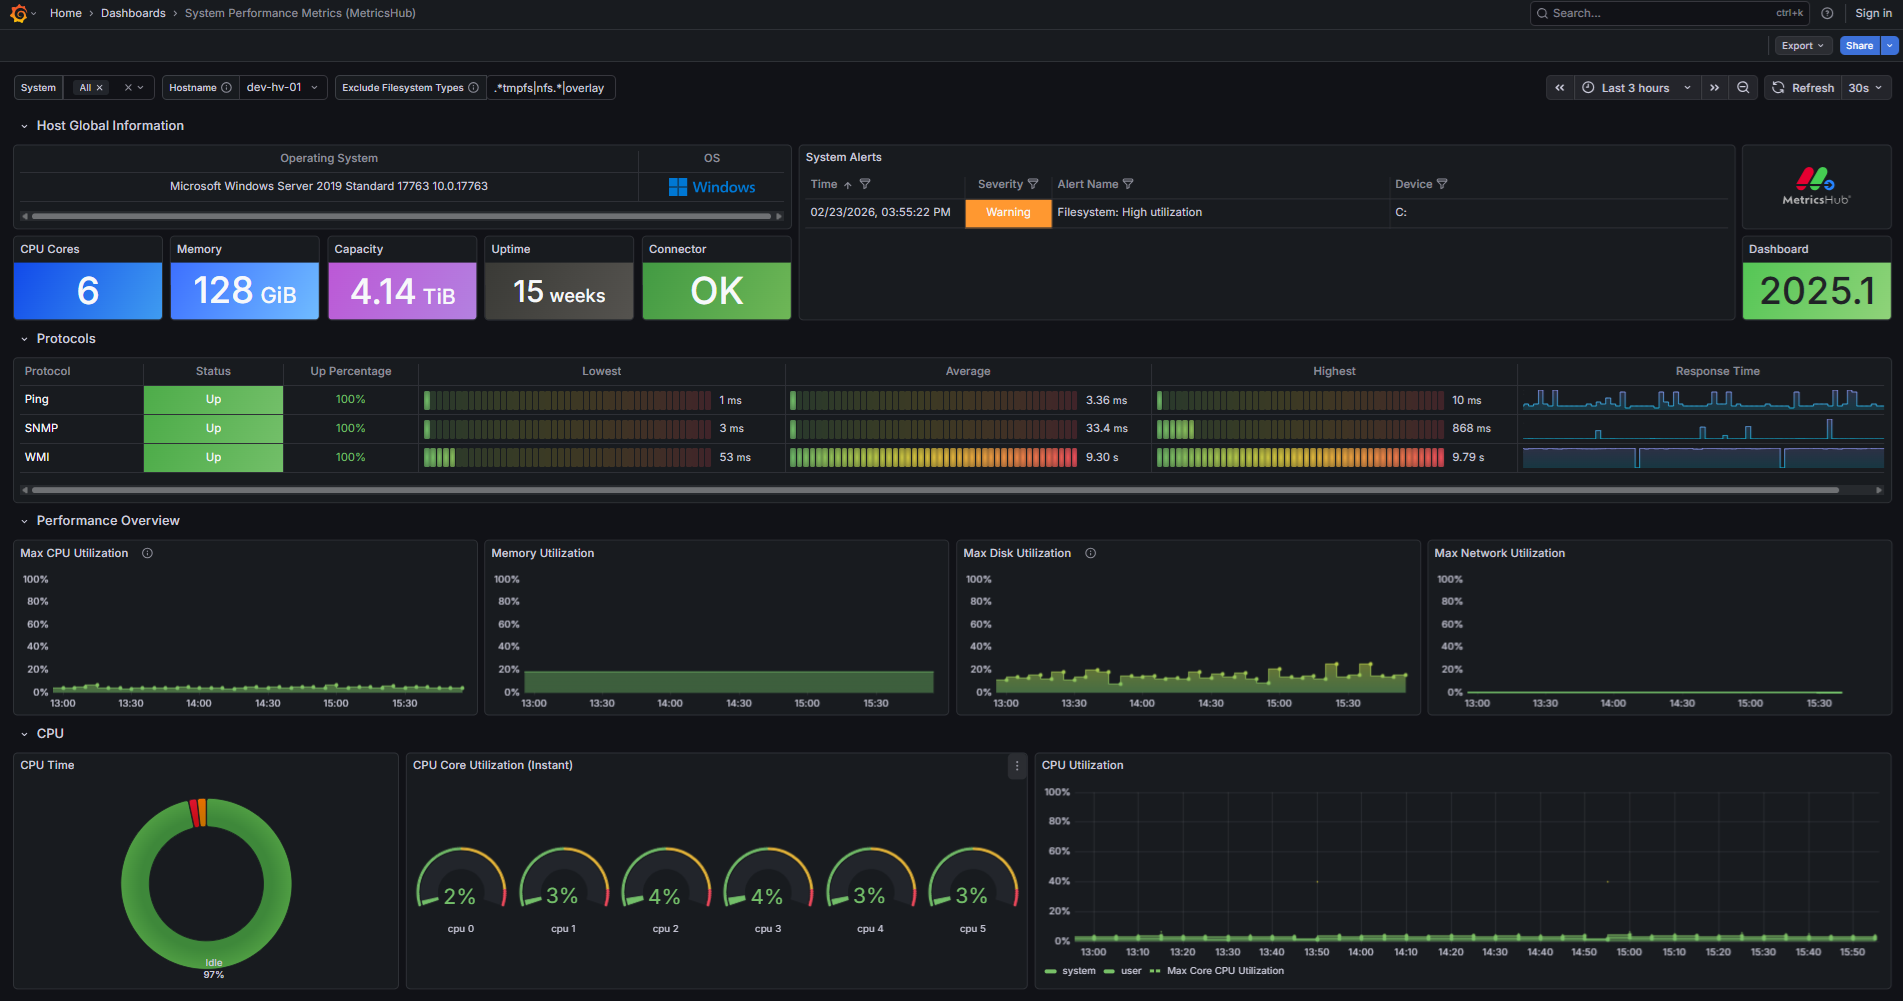
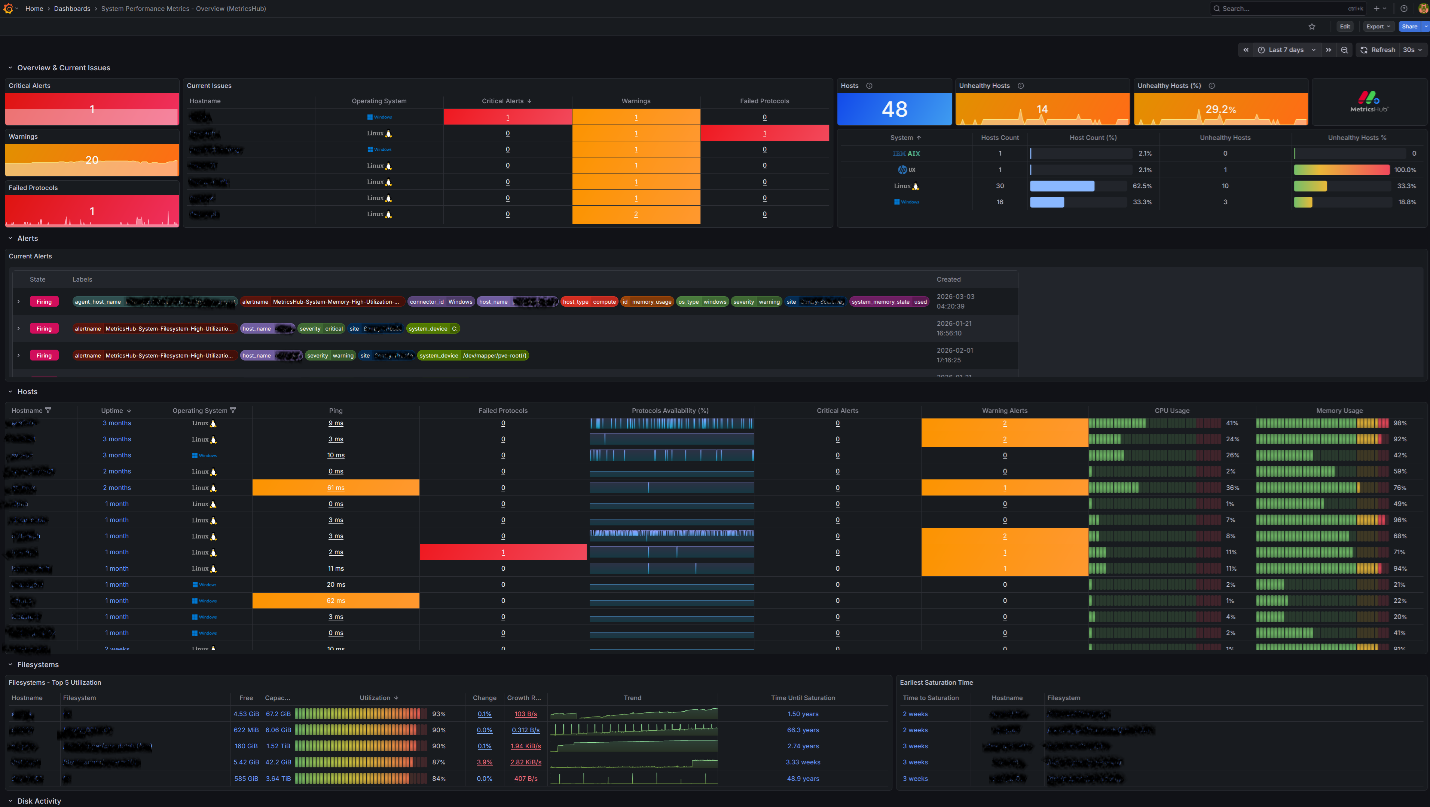
Grafana Dashboard - System Performance Metrics - Overview (MetricsHub)
This section explains how to import these dashboards into Grafana.
Prerequisites
Before importing the System Performance Metrics dashboards in Grafana, ensure that you have:
- properly installed and configured a Grafana server
- configured the system monitoring of your AIX, HP-UX, Linux and Windows servers
- configured a Prometheus Server
- run MetricsHub as well as the Prometheus and Grafana servers.
Importing the MetricsHub dashboards
- Log on to your Grafana server
- Import the dashboard(s)
- Use the following IDs to import the System Performance dashboards for MetricsHub:
| ID | Name | Description | Metrics | Usage |
|---|---|---|---|---|
24972 | System Performance Metrics – Overview (MetricsHub) | Global system dashboard providing a consolidated view of system health and current issues across all monitored hosts. | Aggregated indicators across hosts, including alerts, protocol health, resource utilization (CPU, memory, storage, network), and OS distribution. | Use for situational awareness and triage. Ideal to quickly identify unhealthy systems and prioritize investigation across the infrastructure. |
24058 | System Performance Metrics (MetricsHub) | Host-level dashboard providing detailed performance metrics, protocol health, and system metadata for a selected host. | Detailed per-host metrics, including CPU, memory, filesystem, disk, and network utilization, along with protocol performance (availability, response times) and system metadata. | Use for troubleshooting and root cause analysis. Ideal to investigate a specific host and analyze performance issues in depth. |
- Click Load
- Select the Prometheus data source
- Click Import.
The System Performance Metrics dashboards are now available in Grafana.